
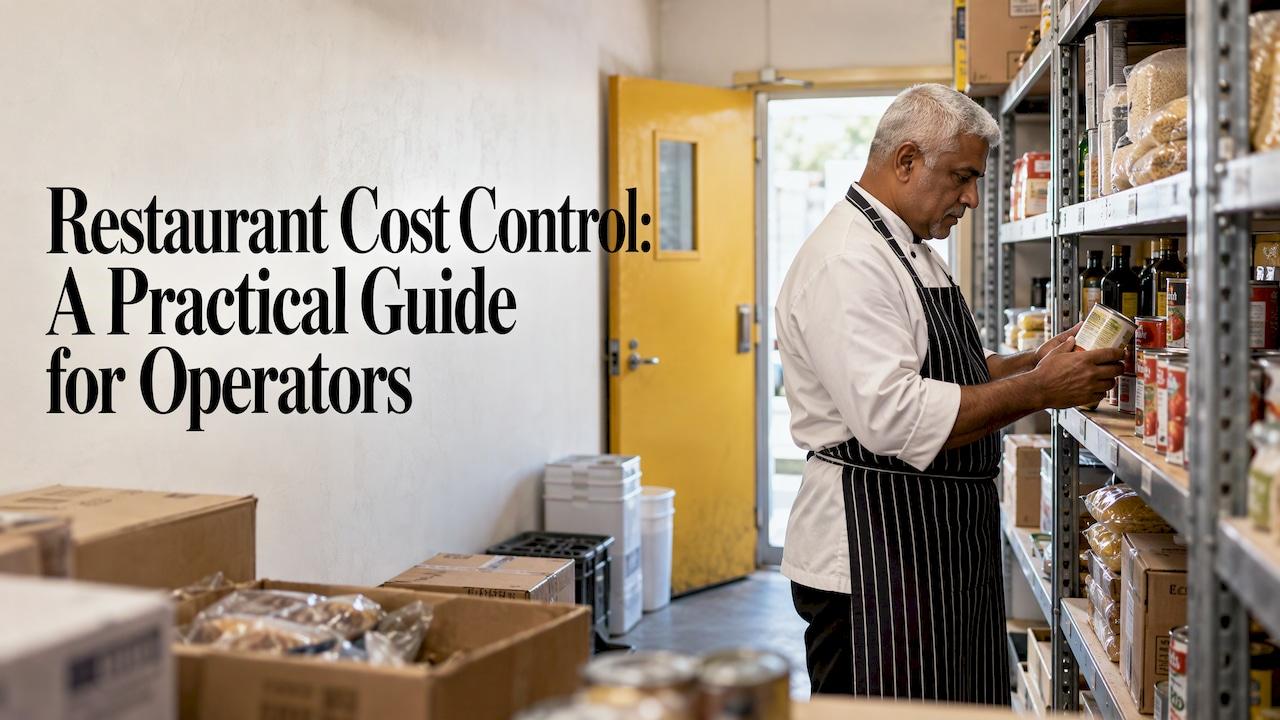
Restaurant cost control is the routine of measuring what you spend on food, labor and overhead, comparing it with what you planned, and acting on the gap while it is still small. It is not one-time belt tightening. The operators who keep margin track a few numbers on a fixed schedule, find the cause of each variance, and fix the process instead of cutting what guests notice.
This guide covers which costs to watch, how to calculate food cost and COGS, which benchmarks to hold yourself against, and how to build a review rhythm that catches problems early.
TL;DR
- Track prime cost (food and beverage COGS plus labor) first. It is the number that tells you whether the business is healthy.
- Calculate food cost percentage as COGS divided by food revenue, and count inventory weekly, not just monthly.
- Compare theoretical usage with actual usage. That variance shows waste, over-portioning and theft far better than one blended percentage.
- Cut cost through purchasing, recipes and scheduling, not through portions guests can see.
- Review a short daily report and a fuller weekly one, and assign an action to every miss.
Table of Contents
- Know which costs you are controlling
- Benchmarks: what a healthy number looks like
- Calculate food cost and COGS correctly
- Use variance, not just a percentage
- Recipe costing and portion control
- Cut cost without cutting quality
- Pricing and labor: the other half of prime cost
- Build a review rhythm that sticks
- Perspective
- Getting outside help with the numbers
- FAQ
- Sources
Know which costs you are controlling
Most owners say "cost control" and mean food. Food matters, but it is one piece of a larger system. Prime cost is COGS (food and beverage) plus labor, while operating costs also include rent, utilities, software, marketing and transaction fees. Prime cost is the one to manage most closely because it is the largest and the most controllable.
Food cost control itself is broader than ingredient prices. It runs through procurement, storage, portioning, distribution and waste reduction. A loss at any step, from a short delivery nobody checked to a walk-in cooler that is badly organized, flows straight into your COGS.

Why the pressure is real: Restaurant365 research reported by QSR Magazine found operators spend roughly 30% of sales on food while average profit margins stay below 10%. On margins that thin, a two-point slip in food cost can erase a large share of profit.
A simple map of the cost chain
Think of it as six stops, each with its own control:
- Purchasing: specifications, approved suppliers, par levels and price checks.
- Receiving: weigh and count against the invoice, check temperatures and quality, reject what does not match.
- Storage: label, rotate first in, first out, and keep high-value items secured.
- Production: standardized recipes, prep sheets sized to forecast.
- Service: portion tools, plating guides, comp and void rules.
- Analysis: inventory, variance and reporting.
The point of drawing it is to find where your leak is. Gaps in any one area create losses that compound, so fixing only the stop you happen to be watching rarely moves the total.
Benchmarks: what a healthy number looks like
The Restaurant Association's guide suggests a food cost percentage between 28% and 35%. It adds that above 35% you have a problem to fix, while 25% to 28% can signal a very tight operation, possibly one cutting corners. The same guide lists U.S. ranges by concept:
| Concept | Typical food cost range |
|---|---|
| QSR / fast food | 25% to 30% |
| Fast casual | 28% to 35% |
| Casual dining | 28% to 35% |
| Fine dining | 28% to 38% |
| Pizza / Italian | 25% to 32% |
| Seafood / steakhouse | 30% to 40% |
For prime cost, fast casual operators look to balance it between 55% and 58% on average. On labor alone, Fourth's rising costs guide says most restaurants aim to stay below 30%, with full service targeting 20% to 30% and quick service and fast casual around 20%.
Treat these as starting lines, not verdicts. A steakhouse at 36% with a strong check average may be fine, and a pizzeria at 36% has a leak. For a comparison against similar operators, the National Restaurant Association's 2025 Restaurant Operations Data Abstract draws on surveys of more than 900 restaurants nationwide and is built to help operators spot cost discrepancies.
Calculate food cost and COGS correctly
The formula is simple. COGS equals beginning inventory plus purchases minus ending inventory. Food cost percentage is COGS divided by total food revenue, times 100.
Here is an illustrative week (the figures are made up to show the math):
- Beginning inventory: $12,000
- Purchases during the week: $18,000
- Ending inventory: $11,000
- COGS: $12,000 + $18,000 − $11,000 = $19,000
- Food revenue: $60,000
- Food cost: $19,000 ÷ $60,000 × 100 = 31.7%
That lands inside the casual dining range. If the same week showed $21,000 in COGS, food cost would be 35%, and you would want to know why before the month closes.
Count more often than you think you need to
The Restaurant Association guide suggests taking inventory weekly, and sometimes twice a week for high-value or high-waste items, so you can detect problems sooner than a monthly count would. A monthly count tells you that you lost money. A weekly count tells you roughly when and where.
If a full count every week is too heavy, use a daily count on a short list. Restaurantowner.com describes counting the top 10 to 15 products: record opening quantity, add purchases, count closing quantity, calculate usage, and compare it with what your POS says should have been used. Proteins, seafood, cheese, liquor and anything with a high price per pound usually earn a spot on that list.
Use variance, not just a percentage
A single food cost percentage hides the story. Two kitchens can both report 32% for opposite reasons: one has a pricing problem, the other has waste that a high check average is covering.
Variance analysis compares theoretical usage (what your sales and recipes say should have been used) with actual usage (what left the shelves). CostMyMenu calls it the most powerful tool in cost control because it separates waste, theft and inefficiency from simple price changes.
To make variance useful:
- Split it by category and item. Aggregate food cost is less actionable than a breakdown by protein, produce, dairy and bar.
- Start with the biggest dollar gaps. A 4% variance on ribeye matters more than 20% on parsley.
- Ask a fixed set of questions. Was the recipe followed? Was it portioned correctly? Was it received at the right weight? Was it rung in? Was it comped, wasted or eaten by staff without being logged?
- Write down the fix and an owner. A variance without an assigned action repeats next week.
Recipe costing and portion control
Every menu item should have a standardized recipe with exact measurements and a current plate cost. The Restaurant Association guide recommends standardized recipes with precise measurements for consistent food cost control. Recost your top sellers whenever a key ingredient price moves, not once a year.
Portion control is where recipe math meets the line. A Penn State foodservice management chapter explains that following standardized serving sizes ensures the recipe produces its planned portions, and that serving a larger portion reduces how many portions the recipe yields and raises cost per portion. A quarter-ounce of extra protein on every plate sounds trivial until you multiply it by a thousand covers.
Practical tools that cost little:
- Portion scoops, ladles and scales at the stations that use the most expensive items
- Photo plating guides taped at the pass
- Prep sheets sized to the forecast so you do not overproduce
- Yield tests on whole proteins and produce, so the cost per usable ounce is known, not guessed
Cut cost without cutting quality
The fastest way to lose regulars is to shrink what they can see. Restaurant Bottom Line recommends focusing reductions on operations, procurement and recipe optimization rather than visible portion cuts, so guest perception holds.
In practice, that means:
- Rebid and consolidate purchasing. Ask two or three approved suppliers to quote your top 20 items, and review the list on a schedule.
- Tighten receiving. Weigh deliveries and reject short shipments. It is the cheapest control there is.
- Use the whole product. Trim becomes stock, staff meals or a special, as long as it is tracked.
- Trim the menu. Fewer slow-moving items means fewer ingredients to stock, less spoilage and a faster line.
- Engineer the menu. Promote items with strong margin and popularity, and rework or remove items that sell poorly and cost a lot.
Quality also depends on people. QSR Magazine reports that investing in training and clear operating standards, and making sure teams understand why standards exist, improves consistency even when no one is watching. A cook who knows why the portion is 5 ounces holds it on a Friday night.
Pricing and labor: the other half of prime cost
Controlling cost does not mean ignoring price. Still, broad price hikes have limited room before traffic suffers, according to QSR Magazine's reporting on best-in-class operators. Targeted adjustments on items where plate cost has risen, or where guests are least price-sensitive, work better than across-the-board increases.
Labor is the larger controllable lever in many restaurants. The same source says realigning schedules to actual demand can improve labor percentage without hurting service. To do that:
- Build schedules from sales forecasts by daypart, not from last month's schedule.
- Watch sales per labor hour weekly. If it drifts down, hours are outrunning demand.
- Cross-train so one person can cover two stations in a slow hour.
- Track overtime by cause: understaffed shifts, late closes or missed breaks.
Build a review rhythm that sticks
The best controls fail if nobody looks at the numbers. QSR Magazine's description of strong operators points to disciplined, frequent reporting. It recommends a daily report with sales, food cost percentage, labor percentage and prime margin by location, reviewed by the general manager with an action for the next day.
For the weekly review, the same source suggests prime cost percentage, actual versus theoretical food cost, labor percentage of sales, and sales per labor hour. A workable cadence:
| Frequency | What to review | Who |
|---|---|---|
| Daily | Sales, food %, labor %, prime margin; comps and voids | General manager |
| Weekly | Prime cost, actual vs. theoretical food cost, sales per labor hour, top variances | GM and chef, with owner |
| Monthly | Full P&L, supplier pricing, menu mix, recipe costs | Owner and leadership |
| Quarterly | Benchmark against peers, menu and pricing reset, vendor rebid | Owner |
Keep the meeting short and end it with named actions and dates.
Perspective
At LDB Hospitality, we see cost control as an operating habit more than a cost-cutting project. Most owners come to us after a bad month, but the bad month is rarely the real problem. The real problem is that nobody saw the drift three months earlier.
Our approach is data-driven: we look at market trends and customer feedback alongside your numbers, because a cost decision that ignores the guest often costs more than it saves. A cheaper ingredient that guests notice, or a thinner schedule that slows service, shows up later in retention and occupancy.
That is why we build customized strategies around each operation instead of handing every client the same checklist. A boutique hotel restaurant, a neighborhood casual spot and an upscale dining room have different benchmarks, guests and levers. Our aim is measurable improvement in operating efficiency, retention and profitability, and we start by agreeing which numbers define success for you.
If you take one thing from this guide, make it the weekly variance review. It is the cheapest discipline to start and the one that pays back first.
La’Quentin
Getting outside help with the numbers
If you have the data but not the time to turn it into decisions, that is where we come in. LDB Hospitality provides strategic consulting, operational support and performance optimization for hotels and restaurants, built on market analysis and guest feedback evaluation. Our work is designed to help owners improve efficiency and guest experience together.

You can see our hospitality marketing strategies and services or request a consultation to talk through where your costs are drifting.
FAQ
What are the five rules of restaurant cost control?
There is no single official list, but the common version is: track expenses, optimize inventory, minimize waste, train staff on cost awareness, and review results regularly. They work together as one chain from purchasing to analysis, so a gap in one rule undermines the others.
How do you reduce costs in a restaurant without hurting quality?
Start with procurement, receiving, recipe standards and scheduling instead of shrinking portions guests can see. Rebid your top items, weigh deliveries, cost your recipes and align labor to forecast demand. Training staff on why standards exist keeps quality steady while spending falls.
How do you control COGS in a restaurant?
Count inventory weekly, or more often for high-value items, and calculate COGS as beginning inventory plus purchases minus ending inventory. Then compare actual usage with the theoretical usage your sales imply, and investigate the biggest gaps by item. Standardized recipes and portion tools keep the theoretical number honest.
What is a good food cost percentage?
The Restaurant Association guide points to 28% to 35% as a general benchmark, with ranges that vary by concept, such as 25% to 30% for quick service and 30% to 40% for seafood and steakhouse. Above 35% usually signals something to fix, while very low numbers can mean corners are being cut.
How often should I review restaurant costs?
Look at a short report daily, covering sales, food and labor percentages and prime margin. Hold a fuller weekly review of prime cost, actual versus theoretical food cost and sales per labor hour. Do menu, pricing and supplier reviews monthly or quarterly.
Sources
- How to Calculate and Reduce Food Cost in Restaurants (Restaurant Association)
- Improving restaurant food cost margins: benchmarks and tips (Fast Casual)
- What best in-class operators are doing differently to rebuild margin (QSR Magazine)
- How restaurants can protect quality in a cost-conscious market (QSR Magazine)
- Restaurant operating costs breakdown
- Restaurant cost control systems: from theory to practice
- Secrets to mastering rising costs (Fourth)
- 2025 Restaurant Operations Data Abstract (National Restaurant Association)
- 50 ways to cut costs without reducing quality (Restaurantowner.com)
- Managing food and beverage production, Chapter 11 (Penn State)
- Navigating costs and value (Restaurant Bottom Line)