
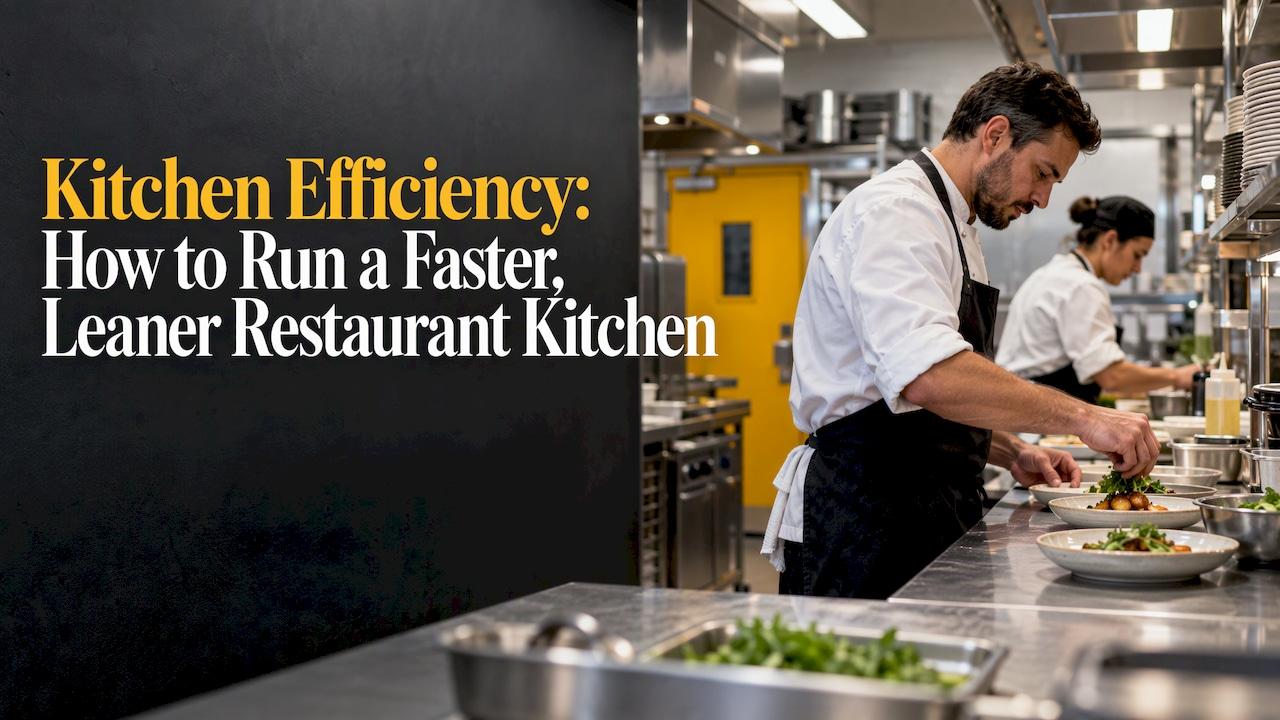
Kitchen efficiency is the amount of correct, finished food your kitchen produces for the labor, space, energy and ingredients it consumes. You improve it by fixing how food, people and orders move through the kitchen, by controlling waste, and by measuring a few numbers every week. You do not improve it by asking cooks to hurry. This guide walks through each lever in the order an operator should pull them.
TL;DR
- Efficiency is output (correct dishes) divided by input (labor hours, space, energy, ingredients). Track ticket times, covers per labor hour, food cost variance and prep yield.
- Your slowest station sets your speed. Fix layout, zoning and handoffs before you add headcount, because extra people in a tight kitchen can slow it down.
- Waste is a daily tracking job: spoilage, prep waste, plate waste and over-ordering each need their own line.
- Old equipment is a hidden operating cost. Documented retrofits have cut equipment costs by about a third.
- Change one thing at a time and compare the same numbers before and after, so you know what worked.
Table of Contents
- What kitchen efficiency actually means in a commercial kitchen
- Why it matters now: the cost pressure on operators
- Layout and zoning: the biggest lever
- Inventory and waste: where food cost leaks
- Equipment and energy: the cost you stop noticing
- How to measure kitchen efficiency
- Hotels and multi-outlet operations
- Where to start this month
- Get a second set of eyes on your operation
- FAQ
- Sources
What kitchen efficiency actually means in a commercial kitchen
Search for the phrase and you will find a lot of advice about home kitchens: work triangles, drawer organizers, island placement. This article is about the other kind, the restaurant, hotel or banquet kitchen where the money is made or lost.
In a commercial setting, kitchen efficiency is the ratio of output to input: finished, correct dishes on one side, and labor hours, space, energy and ingredients on the other. An efficient kitchen gets more covers out per labor hour, with shorter ticket times and less waste, and without the staff feeling rushed.
One industry guide breaks the work into four stages: ordering, prepping, cooking and serving. It defines efficiency as savings in cost, labor, time and energy, reached through portion control, inventory discipline, creative use of leftovers and sensible station layout. That four-stage view is useful because it shows that a kitchen can be slow for reasons that start before the first pan is lit, such as a late delivery or an over-ordered walk-in.

The most common mistake is to treat efficiency as speed. A supplier executive with more than 15 years of experience serving foodservice operations argues that the gap between a chaotic kitchen and a calm one is almost never talent, but systems. Efficiency means food moves through the kitchen with fewer steps, fewer questions and fewer wasted motions.
Why it matters now: the cost pressure on operators
Margins are the reason this topic has moved from nice-to-have to urgent. The National Restaurant Association's industry data, as summarized in a 2026 state of the industry report, shows more than 9 in 10 operators calling food, labor, insurance and overall inflation significant challenges. More than 8 in 10 say the same about card processing fees and energy costs. The same report says 42% of operators were not profitable in 2025, and average food costs sit more than 35% above pre-pandemic levels.
Labor is tight too: 54% of full-service operators say they are looking for chefs or cooks, and 45% are trying to fill kitchen support roles. If you cannot hire your way out, the kitchen you already have has to produce more with the same crew.
The association's chief economist put the year's challenge simply: success will hinge on getting the math right while controlling costs and still delivering value and menu interest. Kitchen efficiency is where that math gets done.
Layout and zoning: the biggest lever
Throughput, the number of orders you can send out correctly per hour, is set by the slowest step in the chain, not by the average speed of the team. A kitchen design analysis makes two points every operator should hear. First, the ceiling is usually set by the layout, not by effort. Second, in tight layouts, adding people can reduce throughput by creating cross-traffic and blocked access.
That source separates three flows worth auditing in your own kitchen:
- Product flow: food travels the shortest possible distance per item, never backtracks, and keeps the cold chain and hot chain apart.
- People flow: each cook owns a station, and cooks are not reaching across each other for the same tools.
- Order flow: tickets move forward with clear handoff points, from the line to the pass to the dining room.
Build zones around activities
The standard approach is zoning. One commercial design guide describes zones strictly devoted to one activity, such as prep, cooking and dishwashing, each stocked with everything the person working there needs. Nobody searches the whole kitchen for a tool.
A foodservice equipment manufacturer's guide recommends preparation zones for raw ingredients, cooking zones aligned with equipment blocks, an assembly or pass area, and washing and waste zones kept separate from food handling. Flow runs from storage to prep, then cooking, then service. Note that this guide is published in the UK, so check local health code requirements in your own jurisdiction.
University design guidelines say the same thing in institutional terms: short travel distances, minimal crossover of paths, open sight lines, and food moving in a logical sequence from receiving to waste disposal.
Check aisles and deliveries
The Foodservice Consultants Society International advises operators, when planning, to consider where deliveries arrive, where food is stored and where the main kitchen sits. It also recommends measuring aisle width with the station installed, since a width that looks fine on a drawing can bottleneck once equipment and cooks occupy it.
Expect a dip after a change
A peer-reviewed study of a Japanese restaurant's kitchen redesign found that staff moving distances fell to the predicted level two months after remodeling, but they actually got longer immediately after the change because the team was not used to the new layout. Plan for that. If you rearrange stations, judge the result after several weeks, not on the first Friday night.
You do not need a full remodel to start. A walk-through on a busy service with a notepad will show you where cooks cross paths, where they walk to fetch the same item repeatedly and where tickets stall. Move the most-used items closer to the station that uses them, and re-check.
Inventory and waste: where food cost leaks
Layout governs time. Inventory governs money. Three practices pay off in almost every kitchen.
First in, first out. Label every delivery with its received date, shelve new product behind old, and train staff to pull the oldest first. Inventory guidance for restaurants also suggests regular manual checks of expiration dates.

Track four kinds of waste separately. The same guidance names spoilage, plate waste, preparation waste and over-ordering. Each has a different owner and a different fix. Spoilage points to ordering and storage. Prep waste points to training and cutting yields. Plate waste points to portion size and menu design. Over-ordering points to par levels.
Put a number on it. A 2025 operator benchmark guide reports restaurants lose about 5.6% of total sales to food waste, and says tracking trim, spoilage and plate waste daily can keep losses under 5% of food cost. Among operators with waste programs, 56% name cost savings as the top benefit. For context, a trade-magazine guide cites a study finding that 30 to 40% of food served in restaurants is never eaten, which is why portion control and creative use of leftovers sit so high on its list.
A practical routine: a waste log at the pass and the dish pit, with one column per waste type, totaled each day and reviewed in a ten-minute weekly huddle. The point is not blame. It is to see which category is biggest this month.
Equipment and energy: the cost you stop noticing
Old equipment drags on efficiency twice, through slower cooking and through higher utility bills. The National Restaurant Association reported on a multi-year study of five California operators in which replacing old cooking equipment with energy-efficient models saved a third of equipment operating costs on average. Examples included a 32% drop in energy use after replacing a broiler, a 41% drop in energy costs after a cookline makeover, and one pub whose annual equipment operating costs fell from $12,380 to $8,220. Those are results for specific California operators, and utility rebates in that state will not exist everywhere, so price your own case.
If space is your constraint, design thinking is moving vertical. An FCSI white paper on smaller kitchens notes that stacked rapid-cook ovens add productive capacity per square foot, and that modular equipment with conveyor or shuttle operation raises capacity per labor hour.
Before buying anything, list your equipment by age, how often it runs and whether it sits on the critical path of your top-selling dishes. Replace the machine that bottlenecks the busiest station first.
How to measure kitchen efficiency
You cannot manage what you do not measure, and four numbers cover most of it. They are the ones commonly used for restaurant kitchens: ticket times, covers per labor hour, food cost variance and prep yield.
| Metric | What it tells you | How to get it |
|---|---|---|
| Ticket time | How long an order takes from entry to the pass | Kitchen display or POS timestamps, or a stopwatch for a week |
| Covers per labor hour | Whether staffing matches volume | Covers served divided by kitchen labor hours for the shift |
| Food cost variance | Gap between what you should have used and what you did use | Theoretical usage from sales mix versus actual inventory usage |
| Prep yield | Usable product after trimming and cooking | Weigh before and after for your highest-cost items |
Add one overall number: prime cost, which is cost of goods sold plus total labor, divided by total sales. That source describes the two as typically making up 55 to 65% of each sales dollar. If prime cost rises while sales hold steady, something in the kitchen is slipping, and the four metrics above tell you where to look. Labor benchmarks in the 2025 guide mentioned earlier run 35 to 40% for quick service, 30 to 40% for casual dining and about 25% for fine dining, so compare yourself with your own segment.
A simple testing routine
- Record two to four weeks of baseline numbers before changing anything.
- Change one thing: a station layout, a prep schedule, a par level.
- Wait at least a few weeks, given the adjustment dip described above.
- Compare the same metrics on comparable days and dayparts, such as Friday dinner against Friday dinner.
- Keep the change if the numbers improved, revert it if not, then pick the next one.
The discipline of changing one variable at a time matters more than any single tactic.
Hotels and multi-outlet operations
Hotel kitchens add complications a stand-alone restaurant does not have: breakfast volume arriving all at once, room service with long delivery paths, banquets with fixed headcounts, and shared prep between outlets. The same principles apply, but the measurement changes. Track breakfast ticket times at peak, banquet prep hours per cover, and waste by outlet. Where one central prep kitchen supplies several outlets, treat the handoff as its own station, with clear labeling, rotation and par sheets.
Where to start this month
- Week 1: walk the line during a busy service and sketch every cross-path and repeated trip.
- Week 2: start the four-column waste log and apply FIFO labeling to every delivery.
- Week 3: pull your baseline ticket times, covers per labor hour and prime cost.
- Week 4: choose the single biggest bottleneck and change one thing about it.
Our perspective
We see the same pattern in hospitality businesses of every size: owners respond to pressure by pushing people harder, when the real constraint is how the operation is set up. A kitchen is one part of a guest experience that also includes the front of house, the menu, pricing and how you attract guests in the first place.
That is why our approach is data-driven. We look at market trends and customer feedback alongside operational numbers, so changes in the kitchen connect to what guests actually want and what drives revenue. Our aim is customized strategies for each hotel or restaurant, from a boutique property to an upscale dining room, rather than a template.
If we had to give one piece of advice, it would be to treat kitchen efficiency as a business question, not just a back-of-house one. Measure first, change one thing, and let the numbers decide.
La’Quentin
Get a second set of eyes on your operation
If you own a hotel or restaurant and want a plan built around your own numbers, our hospitality marketing and management services are designed to combine strategic consulting, operational support and performance optimization for hotels and restaurants. We work from market analysis and customer feedback to shape a strategy specific to your property.

When you are ready to talk through your situation, you can book a consultation.
FAQ
What is the fastest way to improve kitchen efficiency?
Start with a walk-through of a busy service to find cross-traffic and repeated trips, then fix the slowest station. Because throughput is set by the slowest step, improving your fastest station changes little. Pair that with FIFO labeling and a daily waste log, which cost almost nothing to start.
Does hiring more kitchen staff make a kitchen more efficient?
Not necessarily. In tight layouts, extra people can create cross-traffic and blocked access, which can lower throughput. Fix zoning, station ownership and handoffs first, then add staff where the numbers show a real labor shortfall.
Which metrics should I track?
Ticket time, covers per labor hour, food cost variance and prep yield, plus prime cost as the overall check. Record a baseline for a few weeks before you change anything so you can compare like with like.
How long before a layout change pays off?
Expect a short adjustment period. In a published study of a restaurant remodel, staff movement got longer right after the change and reached the predicted improvement about two months later. Judge the change over weeks, not days.
Sources
- Kitchen efficiency: five ways to improve (supplier guide, August 2026)
- Guide to culinary efficiency (FSR Magazine, 2023)
- 2026 State of the Industry Report (NCRLA)
- 2026 State of the Restaurant Industry report summary (National Restaurant Association)
- Designing an efficient kitchen: stations, flow and throughput
- Commercial kitchen design guide
- How to organise a commercial kitchen (April 2026)
- Dining Services Ergonomic Design Guidelines (UC Berkeley)
- Kitchen layouts for ultimate efficiency (FCSI, March 2024)
- Staff motion reduction at a Japanese restaurant by kitchen layout redesign (2017)
- Best practices for restaurant inventory management (March 2026)
- 2025 Restaurateur Benchmark Guide
- Switch out old equipment for new technology (National Restaurant Association, 2021)
- Agile and efficient: designing high-performing smaller kitchens (FCSI white paper)
- How to calculate prime cost for a restaurant